
Journal / Water knowledge
How to read your water report
Understand the measurements and find the details that matter for your home.
Find the right report.
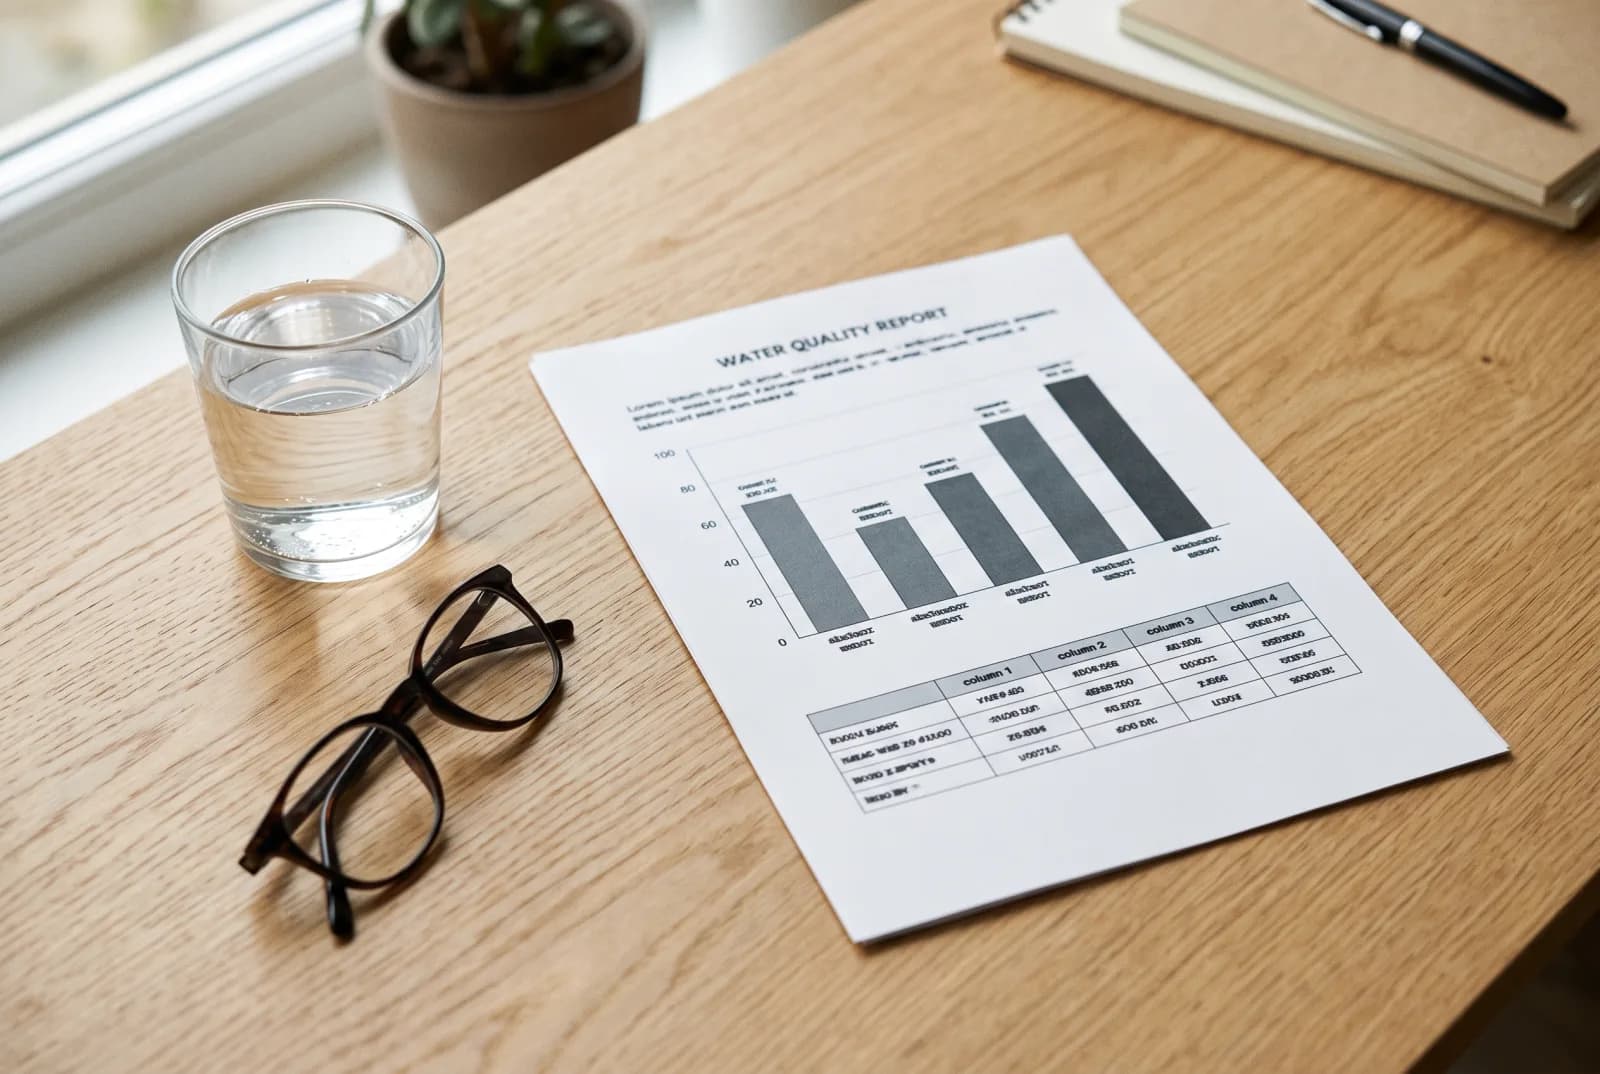
Start with the name of the water supplier on your bill. A report for a nearby city may describe a different system. Check the reporting year and any map or service-area information before reading the figures.
EPA’s Consumer Confidence Report directory is a useful route to the annual report for a US community water system. The report describes sources, detected substances and compliance information for its reporting period.
Decode the vocabulary.
A report places measured results beside limits, goals and treatment requirements. Those columns answer different questions. Read the definition in the report before comparing a result with the number beside it.
| Term | Meaning | How to use it |
|---|---|---|
| MCL | Maximum Contaminant Level: an enforceable limit for a substance. | Compare it with the reported result and the report’s compliance explanation. |
| MCLG | Maximum Contaminant Level Goal: a non-enforceable health goal. | Distinguish the goal from the enforceable limit. |
| Action level | A concentration that triggers specified treatment or other system requirements. | Read the sampling method and the actions described by the utility. |
| Treatment technique | A required treatment process or performance requirement. | Read the process explanation; there may be no single concentration limit to compare. |
| ND / non-detect | The substance was not detected by the method at its reporting limit. | Check the reporting limit and sample date. |
Put the units on the same scale.
A milligram is one thousand micrograms; a microgram is one thousand nanograms. In dilute water reports, mg/L is commonly expressed as parts per million, µg/L as parts per billion and ng/L as parts per trillion.
For example, 0.005 mg/L and 5 µg/L describe the same concentration. A smaller-looking number is not automatically a lower concentration: its unit matters.
| Concentration | Equivalent expression |
|---|---|
| 1 mg/L | 1,000 µg/L |
| 1 µg/L | 1,000 ng/L |
| 0.005 mg/L | 5 µg/L = 5,000 ng/L |
Separate the water supply from the building.
Source-water and treatment-plant tables describe different sampling points from household tap testing. A lead-and-copper table, for example, can summarize a selected set of homes. It does not describe every apartment or house in the system.
When reading a percentile, keep the sample group attached to the number. A 90th-percentile result describes the distribution of the samples collected; it is not a statement that the remaining homes have identical water.
Read the table, then its notes.
A table becomes useful when its context stays attached. Copying one number into a product recommendation can lose the place, period and measurement that give it meaning.
- Check the units. Milligrams per liter and micrograms per liter are different scales.
- Identify whether a value is an average, a range, a maximum or a percentile.
- Read the sampling dates and the footnotes explaining where a result applies.
- Distinguish a measured result from a regulatory limit or goal.
Keep the address in view.
A utility-wide summary is not a laboratory test of your kitchen tap. If you have a specific concern, ask your supplier or local health authority about the appropriate next step and testing method.
For an active advisory, follow the issuing authority’s current instructions. A filter purchase should not substitute for those instructions.
Turn the report into a brief.
Write down what you want to change: taste, a named substance, scale or the convenience of serving water. Then ask for a product’s evidence against that specific objective.
Keep the report with your project documents. It is a better starting point for an installation conversation than a generic claim that all tap water needs the same treatment.